|
|
#1 |
|
Участник
|
powerobjects: Using Canary and Plugin Trace Viewer to Track Down Performance Issues
Источник: https://www.powerobjects.com/2018/07...rmance-issues/
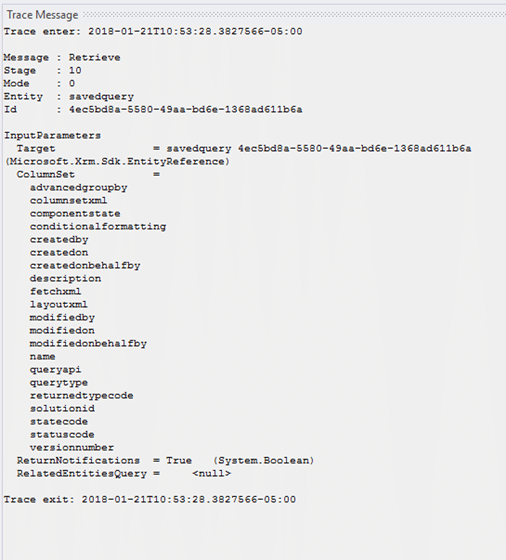
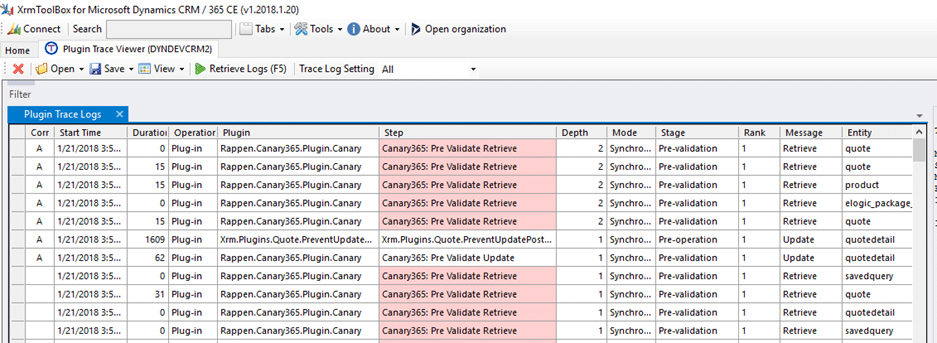
==============  A common request we hear is to do a review of Dynamics 365 customizations to ensure they are working as efficiently as possible. An example of this would be if end users see opportunity product saves that take 30+ seconds or sporadic errors from JavaScript and plugins. In the past, this meant adding trace code through all the plugins for which we had source code, and then figuring out which were triggered by the actual event and which were triggered because of the initial plugin. As you can imagine this would be a daunting task with code you know very little about. Fortunately, there are two tools that can help speed up this process! The first tool is called Canary. Canary is a solution you import into CRM that will dump the IPluginExecutionContext in an easy to read format. Out of the box, Canary has a post-step setup for Updates as well as PreValidation steps for all entities including: Create, Update, Delete, Assign, Associate, Disassociate, Execute, GrantAccess, RevokeAccess, Merge, Lose, QualifyLead, PickFromQueue, Route, SetState, SetStateDynamicEntity, and Retrieve. You can add other steps as needed to help trace down any other issues you may run into. If you add ParentContext=true to the unsecured configuration of the plugin step, this will dump out all the parent context information. This is extremely helpful when trying to track down a recursive plugin call. For example, if there is a plugin that fires on the update of a quote to update the associated quotedetail records, and the quotedetail also has a plugin to push data back up to the parent quote.  The second tool is the Plugin Trace Viewer that is available in the Plugin Store of the XrmToolBox. This tool takes the mountain of data that can be in the CRM Plugin Trace Logs and places it in an easy to read format. It has the option of turning on all tracing, just exceptions, or turning off tracing in CRM. As you can see in the screenshot below, the results are grouped together by the correlation ID which allows you to see the entire set of plugins that were called from one operation in CRM.  The Plugin Trace Viewer has a pane for both the Trace Messages and any exceptions encountered during execution. The tool also allows you to filter the results by date range, plugin, message, entity, and/or the correlation id. These two powerful tools will have you well on your way to tracking down many of the common problems we see in plugin code. You can download the Canary Solution from GitHub here. The Plugin Trace Viewer is best used in the XrmToolBox, which includes many other tools to help speed up the CRM development process. For more tips and tricks, subscribe to our blog! Happy Dynamics 365’ing! Источник: https://www.powerobjects.com/2018/07...rmance-issues/
__________________
Расскажите о новых и интересных блогах по Microsoft Dynamics, напишите личное сообщение администратору. |
|
|